Everything But The House (EBTH) was my first full-time job as a digital product designer. They had a large, internal design and development group who had built much of the software themselves. Initially a local startup, EBTH had been up and running for a few years and funded by another round of investment. They had a downtown Cincinnati, OH office, where I worked, and a processing warehouse in Mason, OH. They also has a number of warehouses in other major US cities which served as distribution centers for those metro areas.
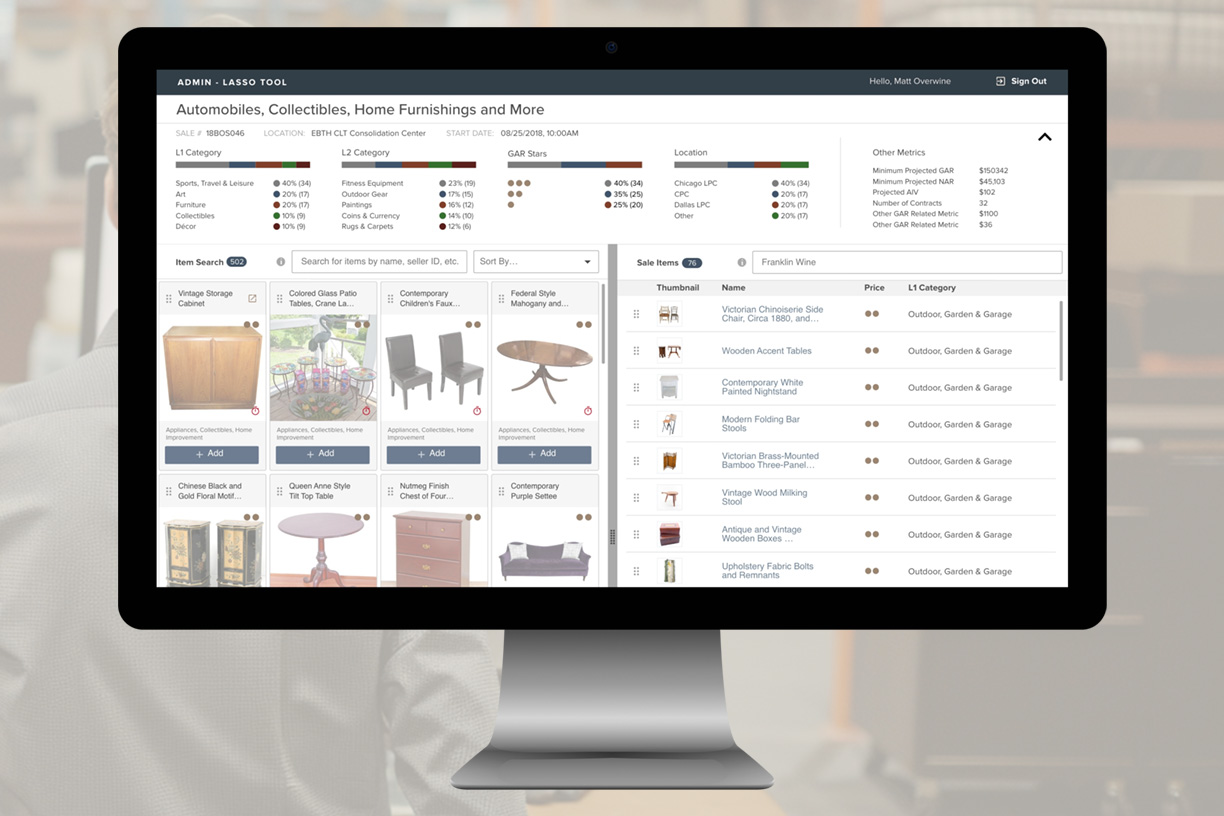
When I was brought on, I was charged with designing and programming a new administrative tool that would be used in warehouses across the country. “Lasso,” as the CTO named it, would help “wrangle” sales to maximize sales.
Historic sales data had shown that final sale prices were often affected by the number of similar items in the same sale. As an example, Rolex watches were a common purchase on the EBTH site. The data analysts found that if you sold three Rolex watches in a single sale, the final sale price would be about the same as if there were one or two. If you had four or five watches, there was a high probability that each Rolex sale would be less.
There were many factors, other than price, involved in making data-driven sales decisions, but the idea was to use all of these factors to maximize each sale.
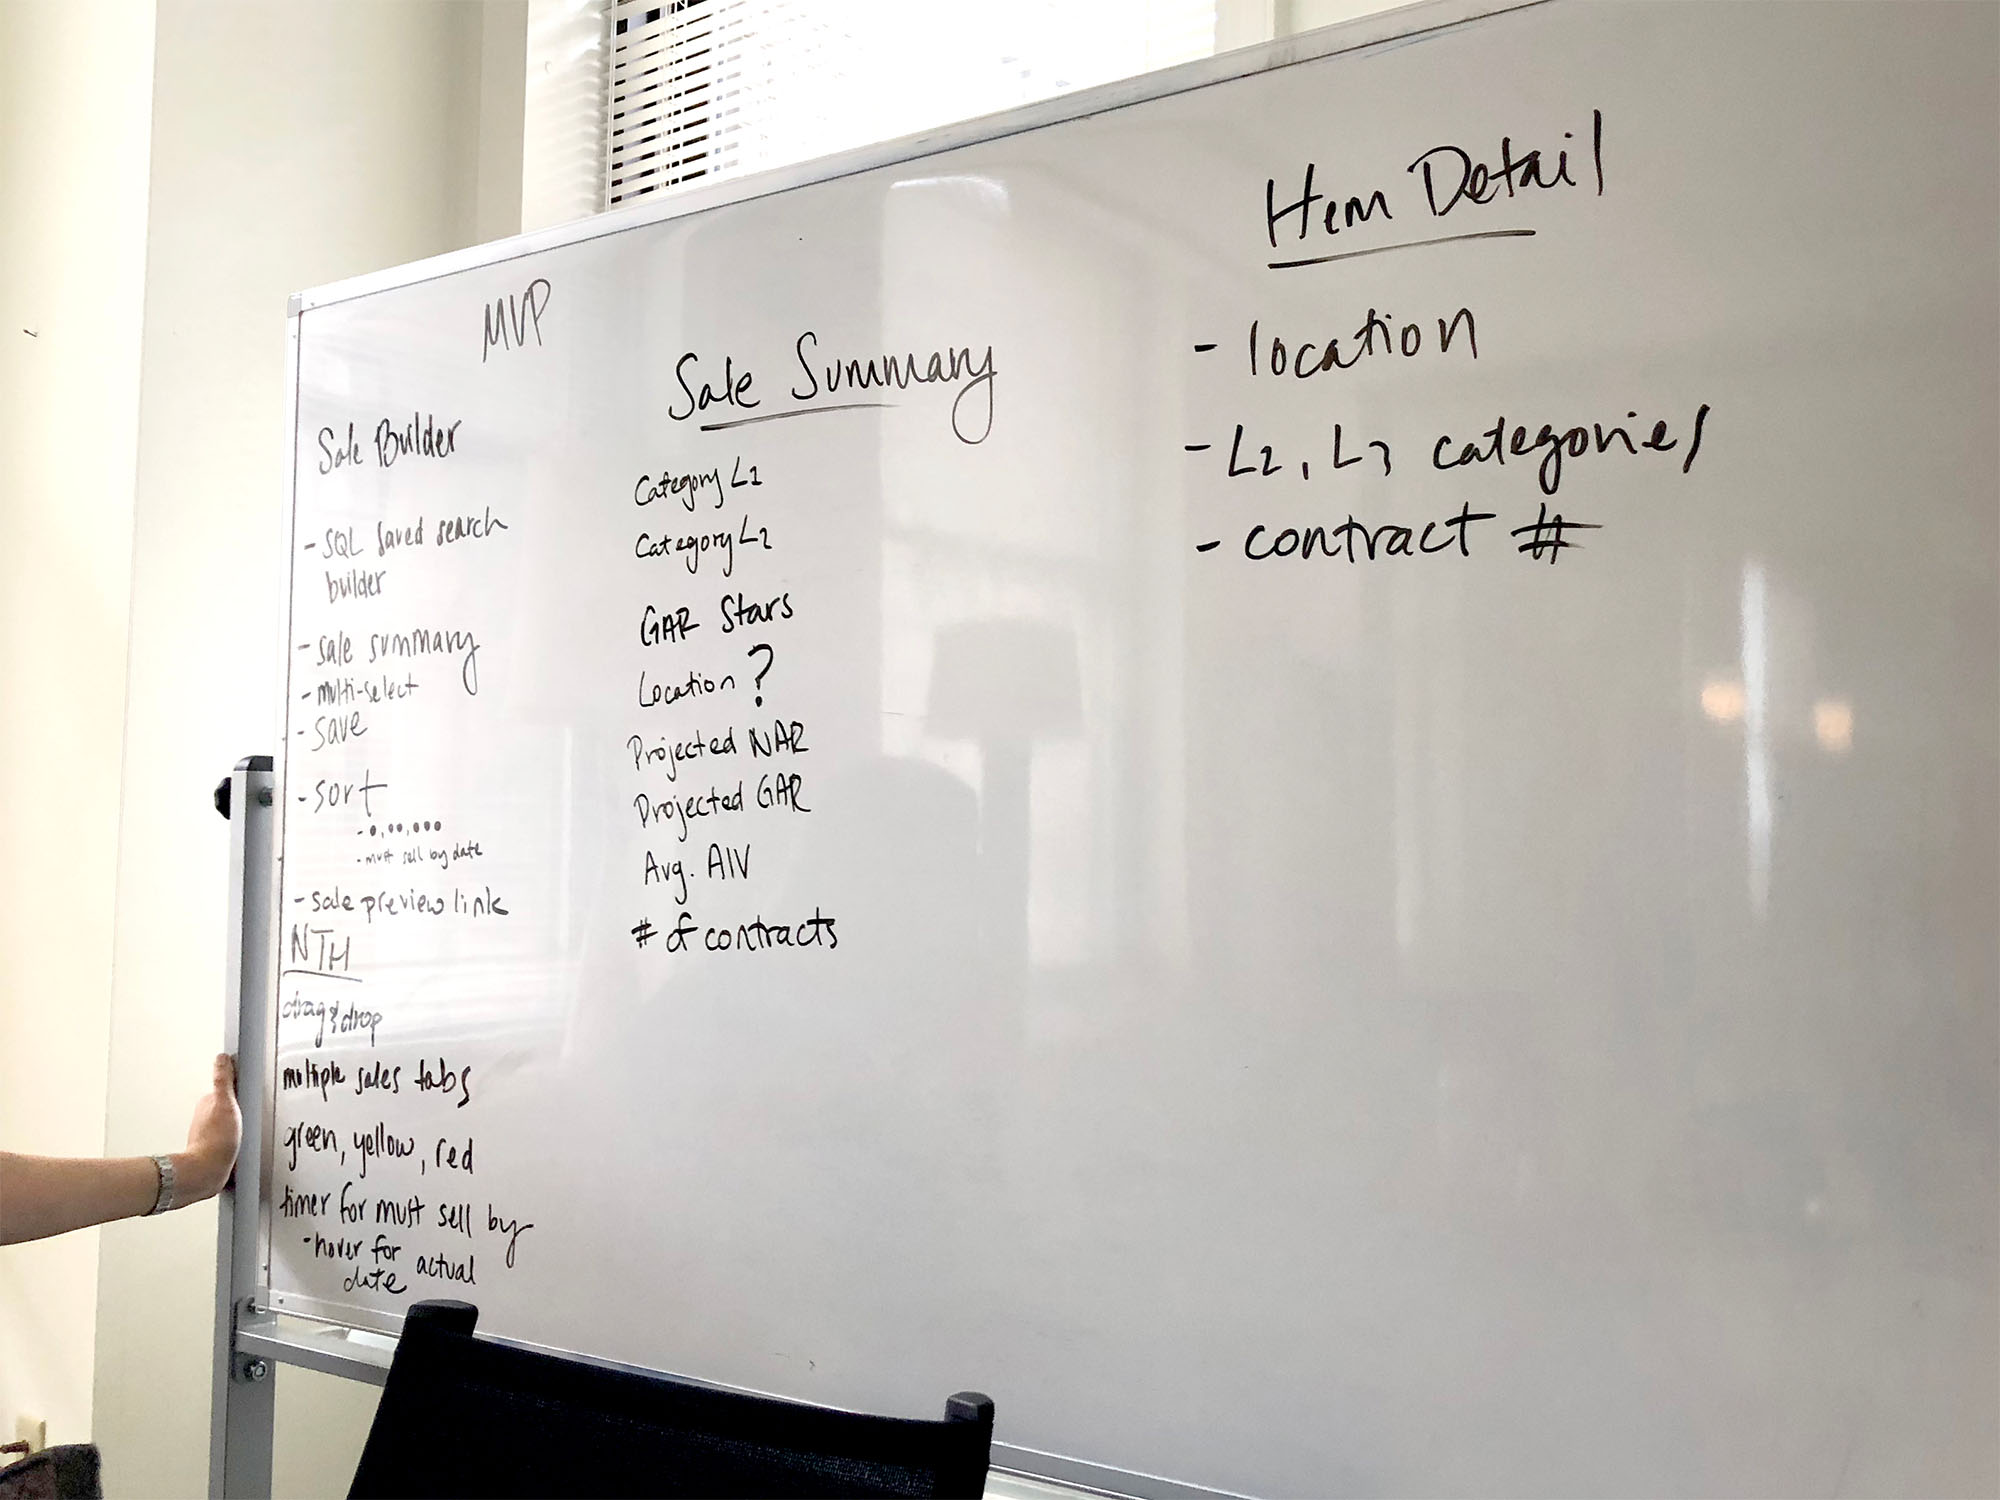
A young Product Manager, Madeline Young, led our team on both design and code sprints. We initially set up our MVP feature-sets separately, then came together with design, technology and analytics in the room to make the final decisions. I was leading product design, Tim Guibord was lead developer, and Senal Kularatne led from analytics.
With everyone in the room, development and data could talk together about how to use the insights they had gained from the historical sales data. Maddie took notes on the board, while I took notes and listened. We came to the list you see in the photo above. This was our MVP feature set for Lasso.
Over the next few months, I was given the opportunity to visit the Mason, OH warehouse, interview workers within different parts of the cataloguing process, watch them work with the existing interface. This gave me insights on how the warehouse workers were using the interface, what concerns they had with their process changing, and what other issues we could solve for while designing Lasso.
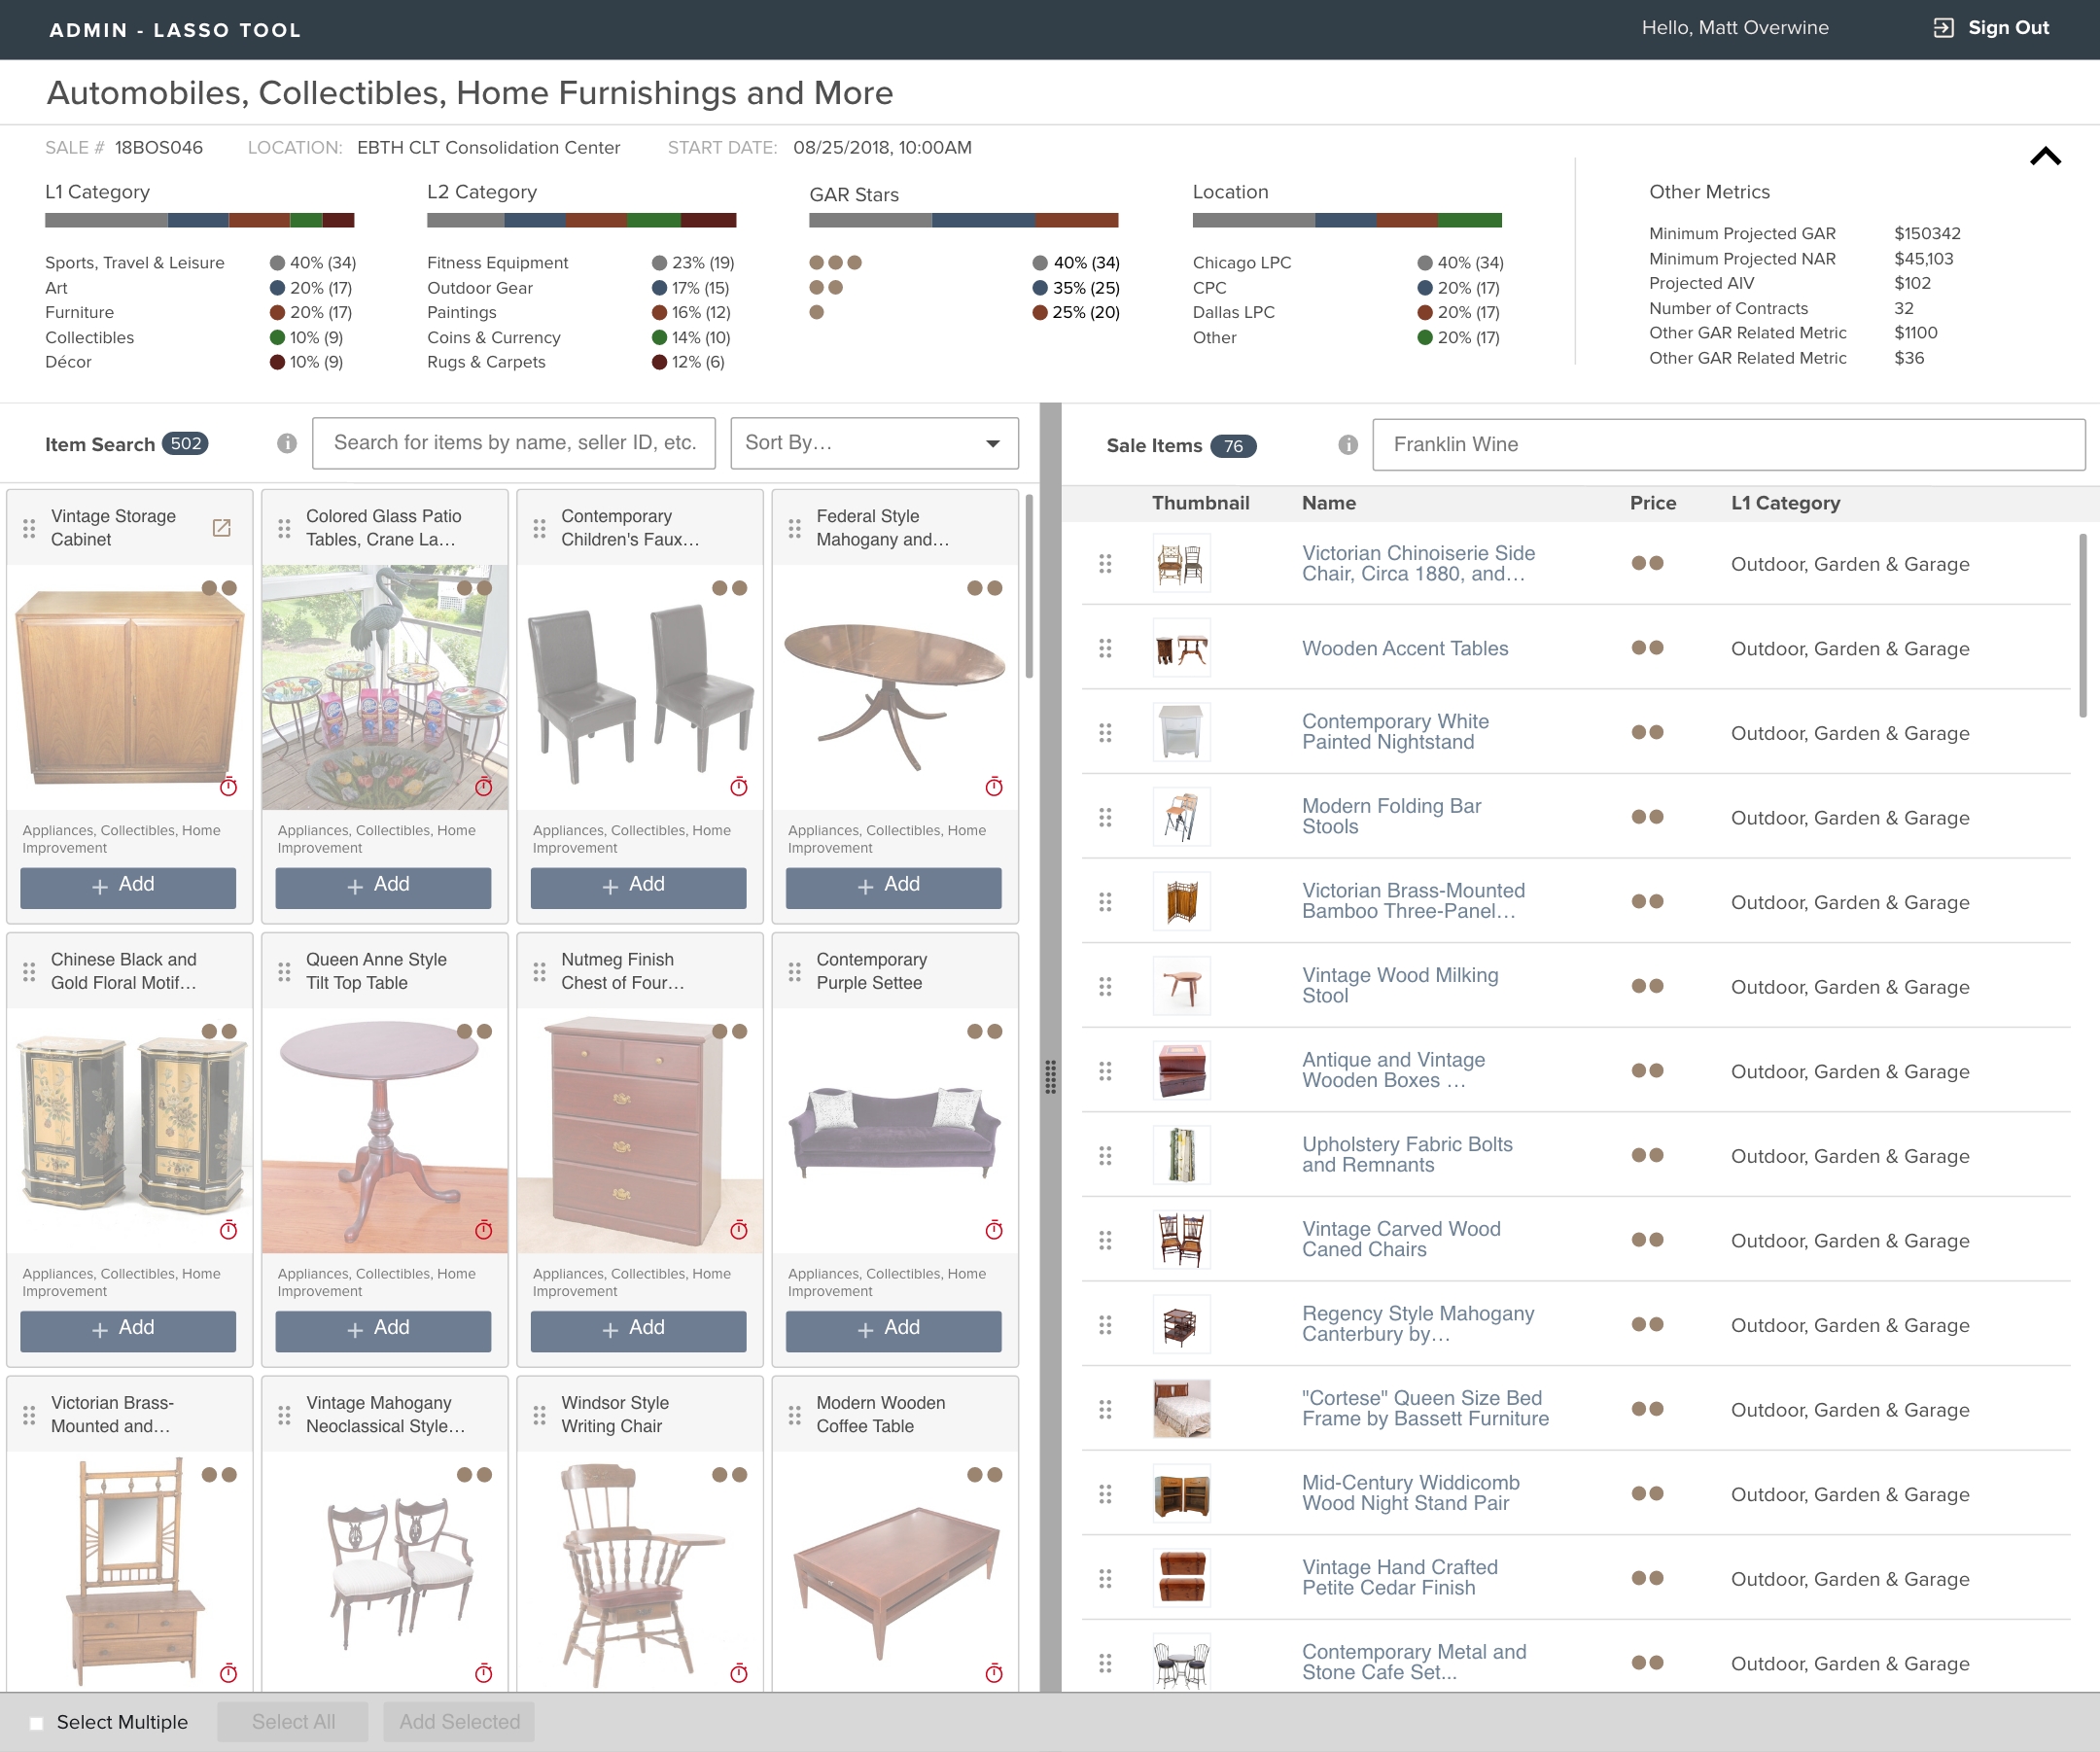
The insights gleaned lead to a single-page design with an expandable, accordion data panel, for getting into the historical sales data, and two, side-by-side panels with an adjustable middle-line. Items on the left were finalized items in the current warehouse catalogue waiting to be added to a sale on the website. On the right were the items in the current sale the user was creating.
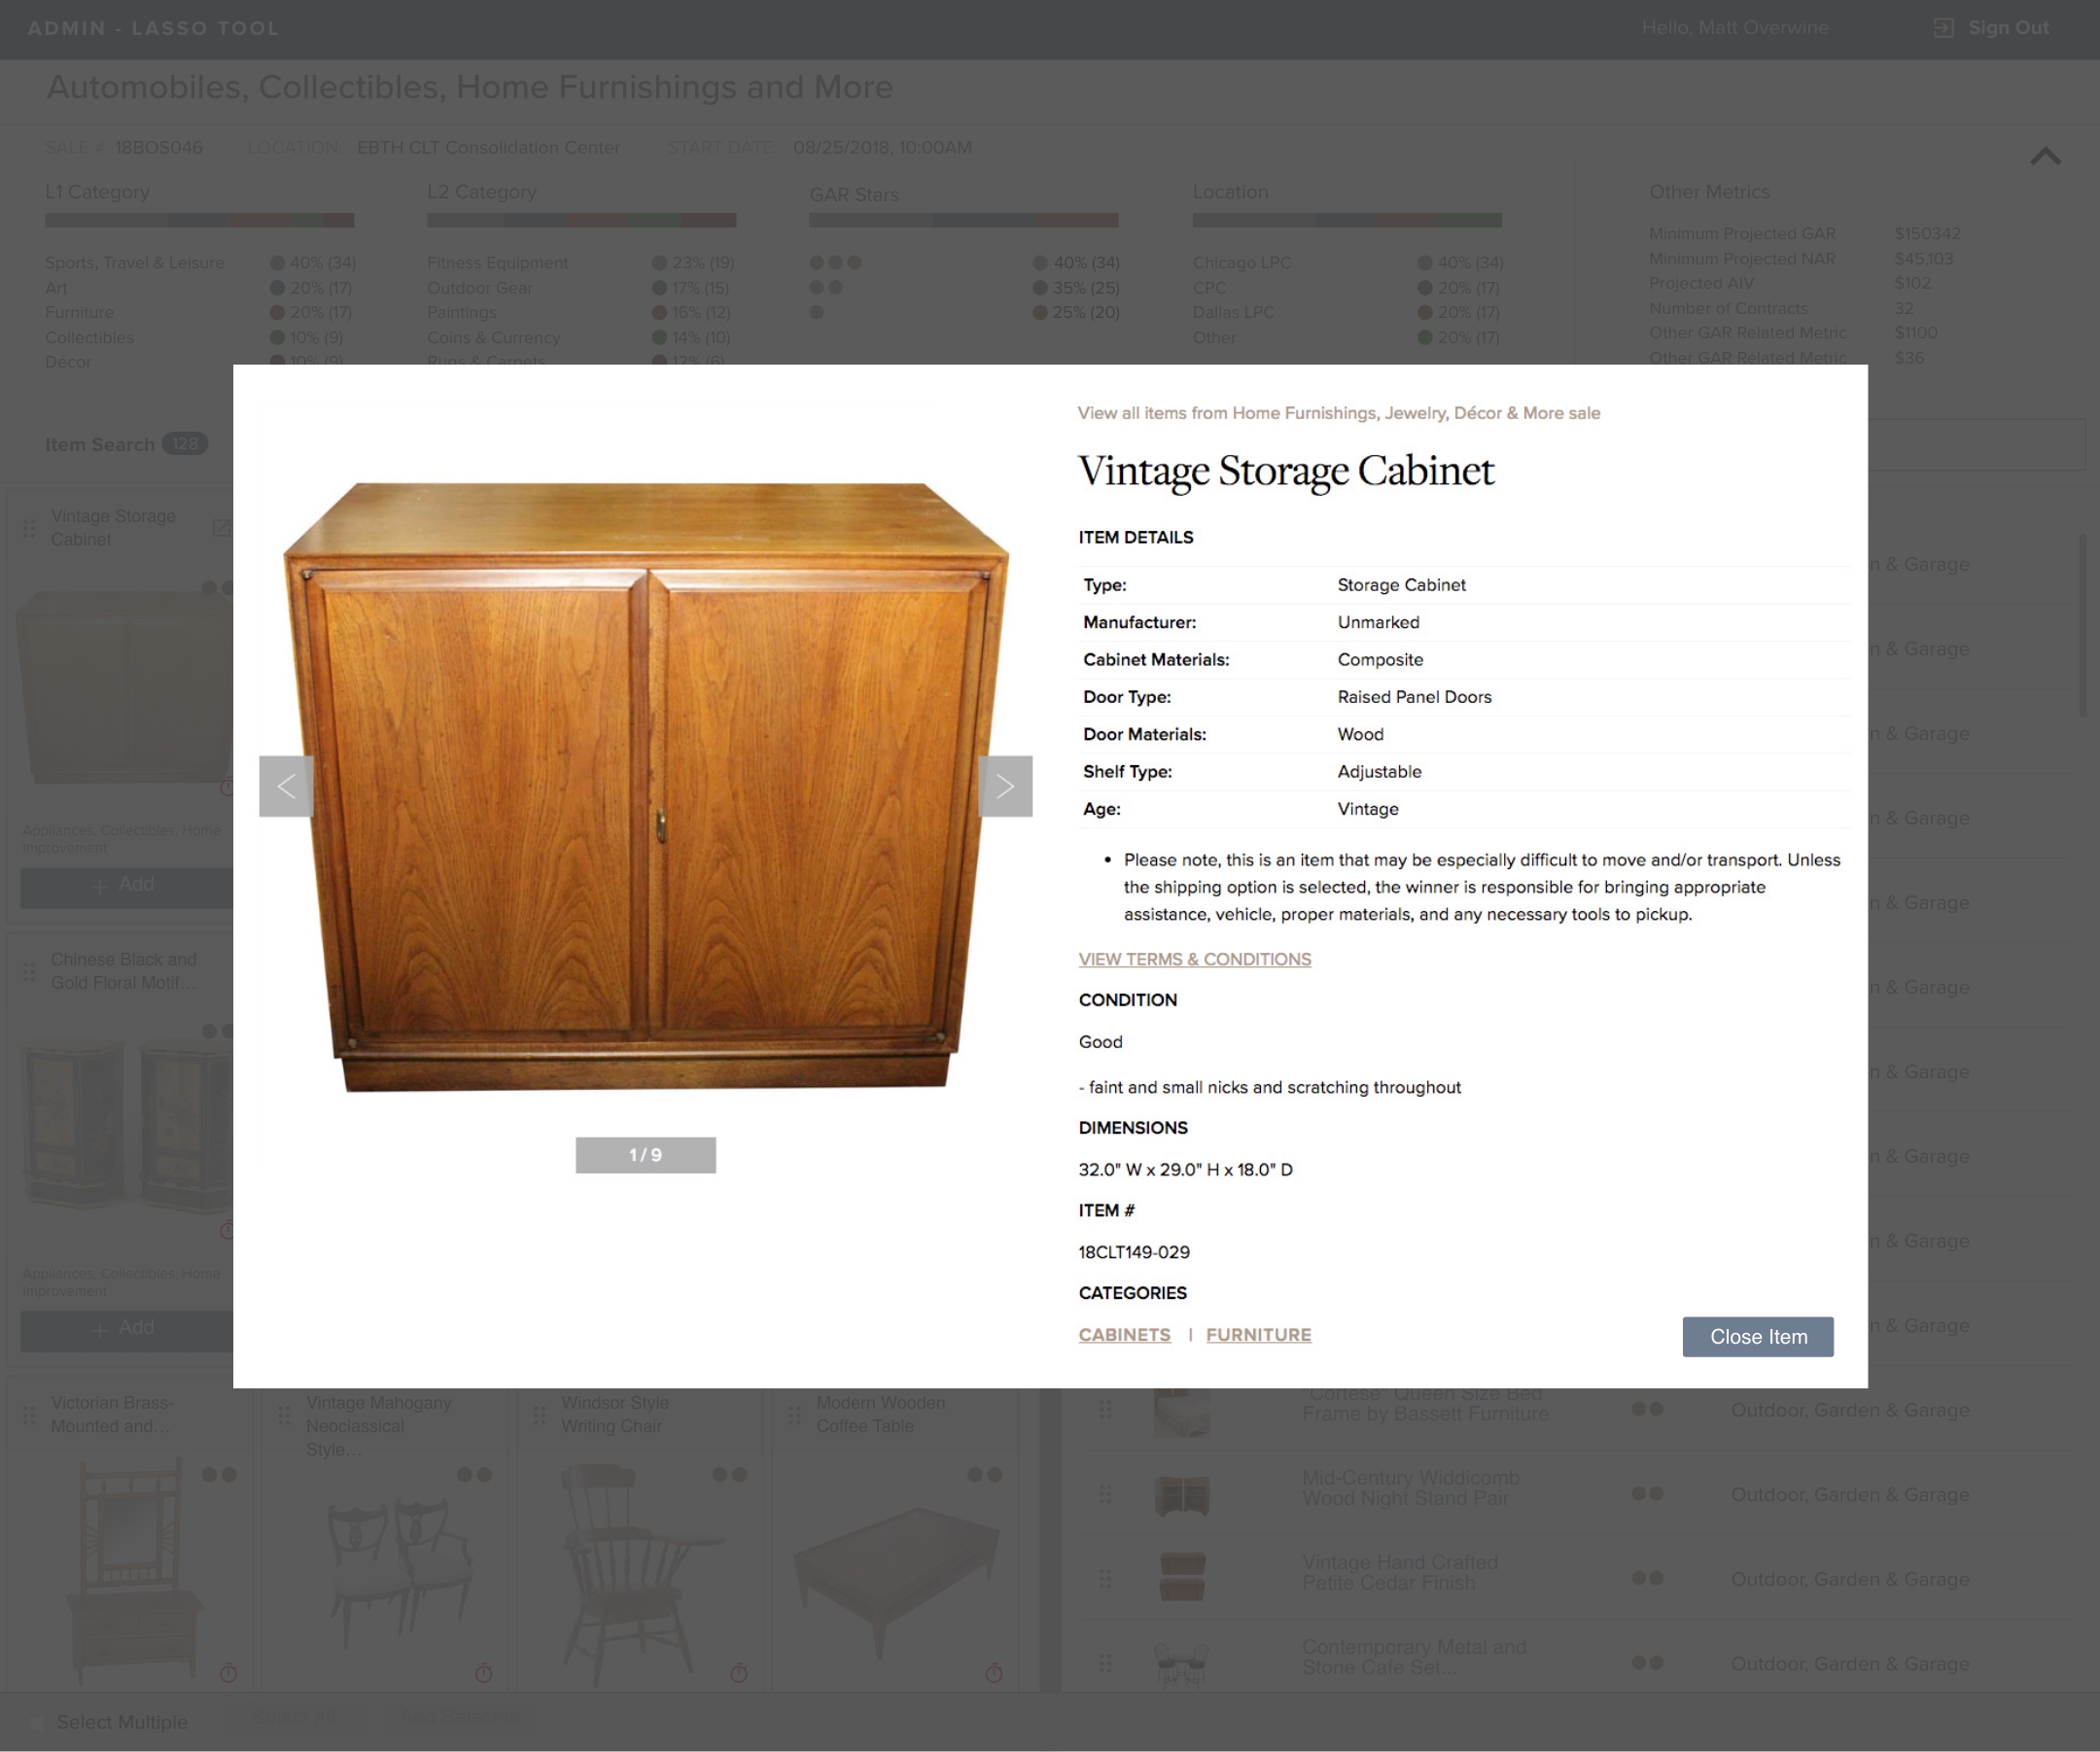
Sale builders could already click on an item to see additional details, before Lasso. Most users liked this, “Item Detail View,” so we decided to keep it in addition to the new interface updates.
While I was able to design and program much of Lasso myself, the EBTH development team definitely stepped up to help when I was using code I didn’t build. I ran the demo for Lasso myself and received praise for managing to wrangle most of the design and programming myself. I met a number of great designers and developers during my time at EBTH. I’ve heard some version of Lasso is still around to this day.